Skip to content
The Model · 2026–2040

Ten thousand balance sheets, modeled.

We built a rule-based model of the whole ambition (every deal archetype, every funding source, every covenant) and published it to be attacked. This is what 10,000 deals does to the machine, the supply, and every stakeholder. It is an illustrative model, not guidance, and it refuses to predict price.

Illustrative modelNot guidanceBase + downside published
2040 model endpoints · base caseCAD · model output, not guidance
10,000
Deals
18 at the 2026 actuals basis
$94.9B
Revenue, 2040
$152.5M run-rate basis, 2026
$0.73 → $18.42
NAV per share
2027 → 2040 · rising every model year
500M
Shares burned, cumulative
Countdown complete · 2038

This is the time-based model. There is also a deal-based stress test with no calendar at all, the same machine measured in deals closed, not years elapsed.

Run the stress test →
The Doctrine

What we model. What we refuse to.

A model earns trust by what it declines to predict. Every output on this page is per-share arithmetic; nothing on this page is a price.

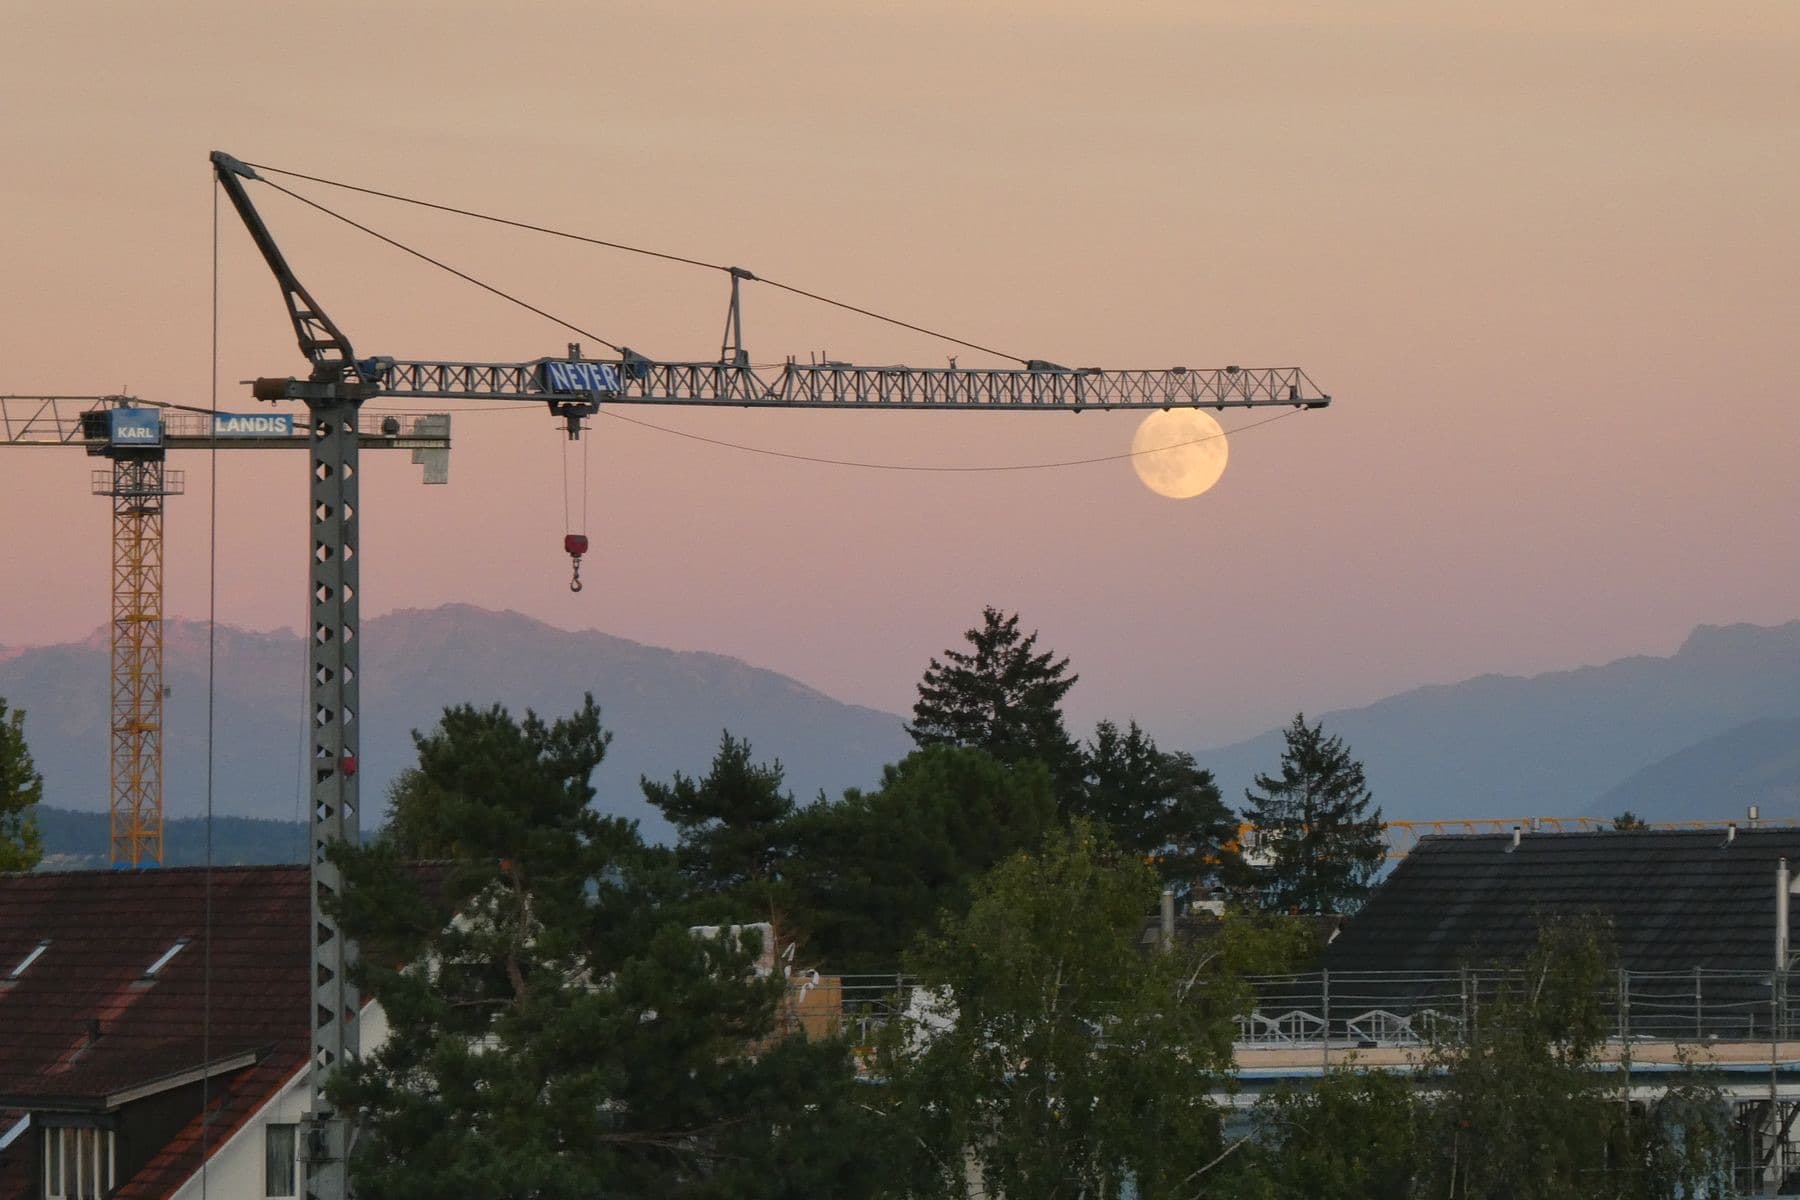
A tower crane against the moon. The long climb from 15 acquisitions to 10,000 deals.
What we model
  • NAV per share (the attested book the tenders price against
  • FCF per share) the cash the Engine runs on
  • Share count (issued against the 1B cap, cancelled toward 500M
  • Distributions) stablecoin dividends to opt-in stakers
  • Leverage, funding mix, and the bond's seniority
What we refuse to model
  • Token price, market cap, or any return figure
  • Yield percentages (a yield is a price divided by a price)
  • Dates presented as promises. Every date here is a modeling input
Price is the market's job. Per-share cash flow is ours. A model that predicted price would be marketing; a model that publishes its arithmetic is a target, and targets are what build trust.
The Climb

From 18 deals to 10,000.

Deals on the platform, year by year, 2026–2040. The y-axis is logarithmic. An honest way to draw a machine whose cadence compounds. 2026 is the only actuals-basis year; every later point is model output.

Deals per year, with eras and milestones

Log scale · model output
VESSELSUPERTRAMPMYCORRHIZANAZAREALBATROSS1001,00010,0001820262026 · 18 deals · actuals basis20272027 · 32 deals · model20282028 · 60 deals · model20292029 · 105 deals · model20302030 · 225 deals · model20312031 · 525 deals · model20322032 · 1,000 deals · model20332033 · 1,620 deals · model20342034 · 2,375 deals · model20352035 · 3,182 deals · model20362036 · 4,007 deals · model20372037 · 5,149 deals · model20382038 · 6,436 deals · model20392039 · 8,058 deals · model20402040 · 10,000 deals · modelTGE100TH DEAL1,000TH DEALBURN COMPLETEDEAL #10,000
2026 · actuals basisModeled path (20272040)Milestone

Revenue and EBITDA per year

CAD · model output, not guidance
$25B$50B$75B$100B2026 revenue: $152.5M · actuals basis2026 EBITDA: $38.2M · actuals basis20262027 revenue: $386.7M · model2027 EBITDA: $83.8M · model20272028 revenue: $774.4M · model2028 EBITDA: $160.1M · model20282029 revenue: $1.50B · model2029 EBITDA: $298.9M · model20292030 revenue: $3.02B · model2030 EBITDA: $591.1M · model20302031 revenue: $6.09B · model2031 EBITDA: $1.19B · model20312032 revenue: $10.6B · model2032 EBITDA: $2.08B · model20322033 revenue: $16.4B · model2033 EBITDA: $3.21B · model20332034 revenue: $23.3B · model2034 EBITDA: $4.57B · model20342035 revenue: $30.9B · model2035 EBITDA: $6.07B · model20352036 revenue: $39.3B · model2036 EBITDA: $7.71B · model20362037 revenue: $50.2B · model2037 EBITDA: $9.87B · model20372038 revenue: $62.7B · model2038 EBITDA: $12.3B · model20382039 revenue: $77.9B · model2039 EBITDA: $15.3B · model20392040 revenue: $94.9B · model2040 EBITDA: $18.7B · model$94.9B2040
RevenueEBITDAModel years (20272040)Solid bars: 2026 actuals basis
The Five Eras

Era by era, deal by deal.

The roadmap names the eras; the model prices them. Each card is the same machine at a different scale: same covenants, same Engine, same discipline.

Era 1 · VESSEL

The Conversion, TGE, and the first post-token deals.

2026–202718 → 32 deals

Court order, bondholder consent, prospectus, four published numbers, then H1 2027 TGE at 300M shares. The bond's initial series deploys; 14 deals close in year one, sourced from the NapkinDeals.com funnel. NAV/share starts at $0.73.

Revenue exit
$387M
Engine
20% · $6M
NAV/share
$0.73
Era 2 · SUPERTRAMP

The 100th closed deal. The milestone we ask to be judged on.

2028–202932 → 105 deals

73 deals in two years, still hand-scale. The 100th deal closes in 2029; per-deal economics published for every one. Cumulative attested FCF crosses $100M, arming the Engine's first step-up. Scout bounties reach ~$6M a year.

Revenue exit
$1.5B
EBITDA
$299M
NAV/share
$1.02
Era 3 · MYCORRHIZA

The network effect: shared infrastructure across a thousand deals.

2030–2032105 → 1,000 deals

Deal cadence goes to software speed: 120, 300, then 475 closes a year, 65–70% micro tuck-ins. The Engine steps 30% (2030) then 40% (2032) on hard-currency milestones. Cumulative burn passes 155M shares; outstanding peaks at ~658M in 2031 and starts falling. The countdown becomes visible on-chain.

Revenue exit
$10.6B
Engine
40% · $300M
NAV/share
$1.99
Era 4 · NAZARE

The big wave: self-funding, Constellation-scale, still counting down.

2033–20361,000 → 4,007 deals

Retained FCF now funds most acquisitions. The machine buys companies with its own cash flow, the arc Constellation proved. Treasury issuance thins against the 1B cap (equity consideration ~$110M/yr, capped); sellers who want equity buy it in the market instead. Distributions reach $600M+ a year.

Revenue exit
$39.3B
FCF
$3.1B
NAV/share
$6.54
Era 5 · ALBATROSS

The countdown completes. RSX opens. The 10,000th deal is small on purpose.

2037–20404,007 → 10,000 deals

The 500M cumulative burn target is reached in 2038. The buyback leg rolls into distributions, which reach ~$2.6B a year. Outstanding settles at ~473M shares against 973M ever issued. RSX activates with the portfolio as its inaugural listings. The 10,000th deal closes in 2040: a nine-employee shop the public market never had a door for.

Revenue exit
$94.9B
Distributions
~$2.6B/yr
NAV/share
$18.42

ERA FIGURES ARE MODEL OUTPUT, NOT GUIDANCE. DATES ARE MODELING INPUTS, NOT PROMISES.

Supply & Per-Share

The supply shrinks. The share compounds.

The tokenomics heart of the model: issuance capped under 1,000,000,000 authorized, a burn countdown that completes in 2038, and the two per-share lines every mechanism points at.

Share supply vs the hard cap

Millions · model
0250M500M750M1,000M1,000,000,000 AUTHORIZED. NEVER CROSSEDPEAK 658M · 2031COUNTDOWN COMPLETE · 2038OUTSTANDINGCUMULATIVE BURNEDEVER ISSUED20262026 · burned 0.0M · actuals basis (pre-TGE)2027 · outstanding 360.6M · burned 4.3M · issued 364.9M · model20282028 · outstanding 450.9M · burned 12.0M · issued 462.9M · model2029 · outstanding 557.8M · burned 23.2M · issued 581.1M · model20302030 · outstanding 624.1M · burned 49.1M · issued 673.2M · model2031 · outstanding 657.9M · burned 87.3M · issued 745.1M · model20322032 · outstanding 646.4M · burned 154.7M · issued 801.2M · model2033 · outstanding 621.2M · burned 223.8M · issued 844.9M · model20342034 · outstanding 589.8M · burned 289.3M · issued 879.0M · model2035 · outstanding 554.7M · burned 350.9M · issued 905.7M · model20362036 · outstanding 517.9M · burned 408.5M · issued 926.4M · model2037 · outstanding 480.7M · burned 461.9M · issued 942.6M · model20382038 · outstanding 455.2M · burned 500.0M · issued 955.2M · model2039 · outstanding 465.1M · burned 500.0M · issued 965.1M · model20402040 · outstanding 472.8M · burned 500.0M · issued 972.8M · model
OutstandingBurned, cumulativeEver issuedAuthorized cap

NAV per share and FCF per share

CAD · log scale · model
$0.10$1$10NAV/SHAREFCF/SHARE20262026 · pre-TGE, no per-share figures2027 · NAV/share $0.73 · FCF/share $0.09 · model20282028 · NAV/share $0.85 · FCF/share $0.15 · model2029 · NAV/share $1.02 · FCF/share $0.21 · model20302030 · NAV/share $1.23 · FCF/share $0.35 · model2031 · NAV/share $1.58 · FCF/share $0.65 · model20322032 · NAV/share $1.99 · FCF/share $1.16 · model2033 · NAV/share $2.62 · FCF/share $1.90 · model20342034 · NAV/share $3.52 · FCF/share $2.93 · model2035 · NAV/share $4.78 · FCF/share $4.26 · model20362036 · NAV/share $6.54 · FCF/share $5.96 · model2037 · NAV/share $8.98 · FCF/share $8.41 · model20382038 · NAV/share $12.04 · FCF/share $11.36 · model2039 · NAV/share $14.90 · FCF/share $14.13 · model20402040 · NAV/share $18.42 · FCF/share $17.40 · model
NAV/share ($0.73$18.42)FCF/share ($0.09$17.40)
Base case · CADModel output, not guidance2026 = actuals basis
YearDealsRevenueEBITDAFCFEngine %Engine $Shares outBurned cumNAV/shareFCF/shareLeverage
2026Actuals basis18$152.5M$38.2M, , , , 0.0M, , ,
202732$386.7M$83.8M$31.7M20%$6.30M360.6M4.3M$0.73$0.092.71x
202860$774.4M$160.1M$66.1M20%$13.2M450.9M12.0M$0.85$0.152.37x
2029105$1.50B$298.9M$117.2M20%$23.4M557.8M23.2M$1.02$0.212.63x
2030225$3.02B$591.1M$220.4M30%$66.1M624.1M49.1M$1.23$0.352.93x
2031525$6.09B$1.19B$425.6M30%$127.7M657.9M87.3M$1.58$0.653.10x
20321,000$10.6B$2.08B$750.7M40%$300.3M646.4M154.7M$1.99$1.163.10x
20331,620$16.4B$3.21B$1.18B40%$472.9M621.2M223.8M$2.62$1.903.03x
20342,375$23.3B$4.57B$1.73B40%$691.6M589.8M289.3M$3.52$2.932.91x
20353,182$30.9B$6.07B$2.36B40%$945.6M554.7M350.9M$4.78$4.262.76x
20364,007$39.3B$7.71B$3.09B40%$1.24B517.9M408.5M$6.54$5.962.62x
20375,149$50.2B$9.87B$4.04B40%$1.62B480.7M461.9M$8.98$8.412.49x
20386,436$62.7B$12.3B$5.17B40%$2.07B455.2M500.0M$12.04$11.362.36x
20398,058$77.9B$15.3B$6.57B40%$2.63B465.1M500.0M$14.90$14.132.23x
204010,000$94.9B$18.7B$8.23B40%$3.29B472.8M500.0M$18.42$17.402.08x

All currency figures CAD; revenue, EBITDA, FCF, and Engine dollars in millions; shares in millions. 2026 is the management-reported run-rate basis of the dashboard. Every later row is deterministic model output from the published assumptions.

The Deal Tape

Ten deals from the modeled tape.

Deals of every size, sourced the same way: the NapkinDeals.com funnel. From a $2M septic contractor to a twelve-company succession portfolio. The buy box is the constant, the scale is the variable.

Illustrative model deals. These are representative of the buy box, the funnel, and the consideration mechanics. They are not announcements, targets, or actual transactions.

2027Micro tuck-in$2.1M EV · 3.0x

Suncoast Septic & Sitework: Sarasota, FL

50% cash · 25% equity · 25% seller note

A NapkinDeals.com listing 40 miles from CCE's yard. Retiring founder, two crews, Lennar-adjacent work. Closed in 47 days; the seller's equity leg makes him a holder of the platform his crews now feed.

2027Large$78M EV · 5.4x

Panhandle Paving Group: Pensacola, FL

Bond-funded cash majority · 20% equity

The second platform-scale deal, underwritten against the bond's first series. Equipment-heavy, collateral-rich: exactly what the ETN's first-ranking liens were designed to finance.

2028SMB standard$7.8M EV · 3.4x

Twin Rivers HVAC Services: Ocala, FL

Seller elected 40% equity: ranked top of funnel

The equity-preference principle at work: the seller pledged double the average equity component and jumped the algorithmically ranked queue of 22,369+ deals to close in a quarter.

2029Mid-market · deal #100$24M EV · 4.2x

Meridian Electrical Contractors: Jacksonville, FL

35% equity · Deal Scout sourced

The 100th closed deal: sourced by a community Deal Scout who earned a ~$240K vested-NPKN bounty. The milestone the whole model asks to be judged on, closed by the community itself.

2030Mid-market$31M EV · 4.5x

Cascadia Timber Services: British Columbia, Canada

Cash + notes · CAD-native

The first major deal in the issuer's home province: succession-driven, asset-heavy, and a signal that the machine's rails run wherever the sellers are.

2031Platform$195M EV · 5.9x

Heartland Water Infrastructure: Midwest, US

Bond series 2 + equity

Era-3 platform deal: municipal water and utility services across four states. The AI CapEx Supercycle's least glamorous, most durable layer (water in, data out.

2033Mid-market network$42M EV · 4.4x

Andina Logística) Ecuador / Colombia / Peru

Cash + notes via Levector rails

Three family logistics firms in one arrangement, sourced through the LATAM network Levector has run since 2022. The playlist goes properly global.

2035Succession portfolio · 12 companies$160M EV combined

Bavarian Mittelstand portfolio: Germany

Structured succession · staged notes

Twelve family manufacturers, one court-supervised succession structure. The German succession wave meeting the only buyer built to close twelve at once.

2037SMB roll-in$18M EV · 3.8x

Deccan Engineering Services: Pune, India

Cash + equity via Skynet integration

Skynet's engineering arm becomes an acquisition rail: the team that built the AAA stack onboards a 140-engineer services firm onto it in six weeks.

2040Micro tuck-in · deal #10,000$1.9M EV · 2.9x

A nine-employee precision-machining shop: Ohio, US

60% cash · 25% note · 15% equity

The 10,000th deal is small on purpose. A shop the public market never had a door for, whose owner retires with a fair price, a seller note, and 100,000 shares of the machine that bought it. This deal is the mission.

Every modeled deal enters through the same funnel the real ones do: NapkinDeals.com: 22,369+ deals live across 50+ countries, ranked by the equity-preference queue.

Visit NapkinDeals.com
The Dials

Every dial, published.

A model you cannot attack is a brochure. These are all of the inputs (the starting point, the deal mix, the funding stack, the Engine mechanics) stated plainly enough to be rebuilt in a spreadsheet.

AssumptionValueWhy
Starting point18 deals · $152.5M revenue · $38.2M EBITDA (2026 run-rate)The dashboard's platform basis: CCE, GCUC, Rock Solid/Innerflow closed.
TGEH1 2027 · 300M shares outstanding · $125M raisedConversion gates G1–G4 first; prospectus timelines make H1 2027 the realistic window.
FCF conversion60% of EBITDA, before interest (50% in downside)Capex, tax, and working-capital proxy for asset-heavy services.
Organic growth5% per year (3% downside)Below the construction book's own forecast (10–15%); conservatism is the point.
Deal mix5 archetypes, $2.2M to $200M EV, 3.0–6.0x EBITDABuy-box economics: tangible assets, durable cash flow, LBO-serviceable.
Consideration25% seller notes; equity 25%→45% as the currency proves; cash the restThe equity-preference flywheel: bounded by the 1B share cap, honestly.
Issuance ruleAll issuance at 1.15× NAV; never below NAVThe NAV discipline covenant, applied literally.
Supply1,000,000,000 authorized, hard cap; burns stop at 500M cumulativeThe terminal-supply covenant. The model never issues share 1,000,000,001.
The Engine20% → 30% → 40% of FCF at $100M / $500M cumulative attested FCFHard-currency milestones, not deal counts. 50/50 buyback-and-cancel vs distributions.
Buyback priceModeled at NAV (neutral to NAV/share)Conservative: real buybacks below NAV would be accretive. We don't model the discount we hope for.
DebtBond 8% (EUR 500M → 2B program), notes 6.5%, equipment/ABL 7.5%The actual capital stack: Vienna ETN, seller notes, Pathward-style asset financing.
Deal cadence14 deals in 2027 → 1,942 in 2040 (peak ~8 per business day)Only credible with AI-native diligence, which is the entire operating thesis.

The five deal archetypes

ArchetypeEVMultipleEBITDAShare of 2040 count
Micro tuck-in$2.2M3.0x$0.7M~72% of deal count
SMB standard$8M3.5x$2.3M~25%
Mid-market$30M4.5x$6.7M~3%
Large$80M5.5x$14.5M<1%
Platform$200M6.0x$33.3M1–2 per year

Change the dials and the outputs move. That is what makes it a model instead of a promise. The spreadsheet logic is deterministic; attack it.

Stakeholders

What it does for everyone.

One model, six seats at the table. The same arithmetic read from every chair, including the founders', capped at 20% and governed by a published Liquidity Dial, not a padlock.

Holders

  • NAV per share compounds $0.73 → $18.42 across the model (≈28%/yr). Every year up, because issuance below NAV is banned and retained FCF stays in the perimeter.
  • FCF per share grows 8.8¢ → $17.40. The number cancellations compound.
  • The burn countdown completes in 2038: 500M shares cancelled, permanently.
  • Quarterly NAV-referenced tenders bound any discount with a funded, recurring bid throughout.

Stakers (opt-in income)

  • Stablecoin distributions grow $3M (2027) → ~$2.6B a year (2040), including the buyback leg after the countdown completes.
  • Never paid in emitted NPKN. The model contains zero emission yield anywhere.
  • Unstaked holders compound through cancellations instead; both are legitimate ways to hold the same share.

The community

  • Majority of supply at full distribution. The covenant holds in every model year.
  • Deal Scout bounty pool grows $1.9M → $92.5M a year at 1% of closed EV, sourcing becomes a real profession on NapkinDeals.com.
  • Community allocations fully unlock (~2031) before a single founder share does.
The Liquidity Dial

Founders

  • Capped at 20% of supply (including every founder recruited later) against the 40–80% insider genesis tables of prior cycles. The fairness is the size of the allocation, not a padlock.
  • The Founder Liquidity Dial: up to 10% of remaining holdings sellable per year, disclosed on-chain, outside blackout windows. The cohort model shows the worst case. Founders selling the maximum every year still end with a ~$2.5B modeled outcome while the community holds 62%+.

Sellers

  • Equity consideration rises 25% → 45% of deal value as the currency proves itself, then treasury caps bind and late-era sellers buy exposure in the market instead: the 1B cap is honored even when it constrains us.
  • Seller notes (~25% throughout) amortized from portfolio cash flow; ~$9.3B of EV closes in 2040 alone.
  • The equity-preference queue rewards conviction with priority. The sellers most convinced become the largest holder cohort.

Bondholders

  • Senior, secured, first-ranking: paid before the Engine sees a dollar, in every model year.
  • Leverage peaks at 3.1x EBITDA (2031–32) and ends at 2.1x; interest coverage improves every year after.
  • The program grows EUR 500M → EUR 2B as distribution deepens, and future series can be tokenized notes the community itself holds.
Who Earns What

Every cohort, charted.

Four cohorts sit on the allocation table. Founders, rolled legacy holders, the community, and Deal Scouts. These charts track what each one earns, 2027–2040, as buybacks, burns, vesting, and the Founder Liquidity Dial play out.

IllustrativeFully-staked basisModeled at NAV

Cohort lens: full allocation-table basis: 500M shares outstanding at TGE (founders 200M, legacy 100M, community float 200M), escrow released and sold above NAV, ecosystem incentives emitted within the 200M cap, scouts vested against 1% of closed EV. Supply and burn paths differ slightly from the headline Path model because this lens carries every tranche explicitly. Distributions shown on a fully-staked basis; burns modeled as Engine purchases from willing community sellers, at NAV.

The Policy

The Founder Liquidity Dial

Four published rules replace the padlock. A dial anyone can read, disclosure anyone can verify, and a cap that never moves.

Rule 01
The founder pool is capped at 20% of authorized supply (200M shares) including every future founder recruited. New founders are granted from inside the pool, never from the community.
Rule 02
Founders may sell up to 10% of their then-remaining holdings per rolling 12 months. A published dial, not a padlock.
Rule 03
Every founder sale executes outside MAR blackout windows and is disclosed on-chain within days, not quarters.
Rule 04
The dial is a ceiling, not a plan: the model below shows the worst case. Every founder selling the maximum every year.

The fairness is the size of the allocation, not the padlock. Prior-cycle genesis tables gave insiders far more: XRP launched with roughly 80% of supply in insider hands, and BNB's 2017 genesis put 40% with the team plus 10% with angels. The winning-launch cohort averaged 54% to the community. $NPKN caps founders at 20% and the model lands the community above 62%. A founder who cannot dump what he was never over-allocated needs no padlock to prove it.

Genesis tables, compared
XRP (2012)~80% insider genesis
BNB (2017)40% team + 10% angels
Winning-launch cohort avg54% community share
$NPKNFounders capped at 20% · community >62% modeled

A machine that intends to recruit more founders cannot tell them their equity is frozen until the 2030s. That stifles the exact talent the 10,000-deal ambition needs. Alignment comes from three mechanisms that never turn off: the 20% cap, the public dial, and per-share economics that reward holding better than selling.

Replaces the hard Founder-Last lockups of White Paper v5.0 §5.2: formalized in White Paper v6.0 §5.2 (July 23, 2026).

The Cohort Charts

Ownership, value, and cash: four views of one ledger.

The same model read four ways, 2027–2040: who holds the supply, what it is worth at modeled NAV, the founders' worst case against holding, and the cash actually delivered.

Ownership over time, who holds the supply

% of shares outstanding · dial scenario · model output
0%25%50%75%100%COMMUNITY MAJORITY FROM 2028FOUNDERS 36.9% → 9.5%LEGACY 18.4% → 18.7%COMMUNITY & PUBLIC 44.0% → 62.4%SCOUTS 9.4%20272027 · founders 36.9% · legacy 18.4% · community 44.0% · scouts 0.7% · model20282028 · founders 30.5% · legacy 16.9% · community 51.0% · scouts 1.6% · model20292029 · founders 25.8% · legacy 15.9% · community 55.3% · scouts 3.1% · model20302030 · founders 22.4% · legacy 15.4% · community 56.8% · scouts 5.4% · model20312031 · founders 19.7% · legacy 15.0% · community 57.7% · scouts 7.5% · model20322032 · founders 17.9% · legacy 15.1% · community 59.5% · scouts 7.6% · model20332033 · founders 16.2% · legacy 15.3% · community 60.8% · scouts 7.6% · model20342034 · founders 14.8% · legacy 15.5% · community 62.0% · scouts 7.7% · model20352035 · founders 13.5% · legacy 15.7% · community 62.9% · scouts 7.9% · model20362036 · founders 12.6% · legacy 16.3% · community 63.0% · scouts 8.1% · model20372037 · founders 11.8% · legacy 16.9% · community 63.0% · scouts 8.4% · model20382038 · founders 11.0% · legacy 17.5% · community 62.9% · scouts 8.7% · model20392039 · founders 10.2% · legacy 18.1% · community 62.7% · scouts 9.0% · model20402040 · founders 9.5% · legacy 18.7% · community 62.4% · scouts 9.4% · model
FoundersRolled legacy holdersCommunity & publicDeal ScoutsCommunity majority from 2028, every year after

Cohort value at modeled NAV

CAD · log scale · model output
$10M$100M$1BCOMMUNITY $4.58BLEGACY $1.37BFOUNDERS $697.0MSCOUTS $685.5M20272027 · NAV/share $0.47 · founders $94.2M · legacy $47.1M · community $112.2M · scouts $1.80M · model20282028 · NAV/share $0.53 · founders $96.2M · legacy $53.4M · community $161.0M · scouts $5.10M · model20292029 · NAV/share $0.64 · founders $102.9M · legacy $63.5M · community $220.9M · scouts $12.2M · model20302030 · NAV/share $0.77 · founders $112.0M · legacy $76.8M · community $284.1M · scouts $27.2M · model20312031 · NAV/share $1.02 · founders $134.2M · legacy $102.2M · community $392.8M · scouts $51.1M · model20322032 · NAV/share $1.28 · founders $151.3M · legacy $128.1M · community $503.8M · scouts $64.1M · model20332033 · NAV/share $1.68 · founders $179.0M · legacy $168.4M · community $670.4M · scouts $84.2M · model20342034 · NAV/share $2.28 · founders $217.7M · legacy $227.5M · community $910.6M · scouts $113.8M · model20352035 · NAV/share $3.10 · founders $266.7M · legacy $309.8M · community $1.24B · scouts $154.9M · model20362036 · NAV/share $4.20 · founders $325.7M · legacy $420.3M · community $1.63B · scouts $210.1M · model20372037 · NAV/share $5.70 · founders $397.5M · legacy $570.1M · community $2.13B · scouts $285.0M · model20382038 · NAV/share $7.69 · founders $482.6M · legacy $768.9M · community $2.77B · scouts $384.5M · model20392039 · NAV/share $10.31 · founders $582.3M · legacy $1.03B · community $3.57B · scouts $515.4M · model20402040 · NAV/share $13.71 · founders $697.0M · legacy $1.37B · community $4.58B · scouts $685.5M · model
Community & public (to $4.58B)Founders, remaining stakeRolled legacy holdersDeal Scouts (from zero)

Founders: sell the max vs hold

CAD · worst case vs never selling · model output
$1B$2B$3B$4B$5B$6B20272027 · dial scenario: holdings $94.2M at NAV + realized $0.00M + distributions $1.20M = $95.4M · hold scenario total $95.4M · model20282028 · dial scenario: holdings $96.2M at NAV + realized $10.9M + distributions $3.00M = $110.1M · hold scenario total $110.1M · model20292029 · dial scenario: holdings $102.9M at NAV + realized $22.6M + distributions $5.70M = $131.2M · hold scenario total $133.5M · model20302030 · dial scenario: holdings $112.0M at NAV + realized $35.9M + distributions $13.3M = $161.2M · hold scenario total $170.7M · model20312031 · dial scenario: holdings $134.2M at NAV + realized $52.6M + distributions $29.3M = $216.1M · hold scenario total $245.4M · model20322032 · dial scenario: holdings $151.3M at NAV + realized $74.0M + distributions $70.6M = $295.9M · hold scenario total $365.5M · model20332033 · dial scenario: holdings $179.0M at NAV + realized $100.7M + distributions $132.1M = $411.8M · hold scenario total $557.4M · model20342034 · dial scenario: holdings $217.7M at NAV + realized $134.2M + distributions $215.5M = $567.4M · hold scenario total $841.2M · model20352035 · dial scenario: holdings $266.7M at NAV + realized $175.4M + distributions $320.2M = $762.3M · hold scenario total $1.23B · model20362036 · dial scenario: holdings $325.7M at NAV + realized $225.8M + distributions $447.9M = $999.4M · hold scenario total $1.76B · model20372037 · dial scenario: holdings $397.5M at NAV + realized $287.3M + distributions $604.1M = $1.29B · hold scenario total $2.46B · model20382038 · dial scenario: holdings $482.6M at NAV + realized $361.7M + distributions $790.3M = $1.63B · hold scenario total $3.37B · model20392039 · dial scenario: holdings $582.3M at NAV + realized $450.8M + distributions $1.01B = $2.04B · hold scenario total $4.57B · model20402040 · dial scenario: holdings $697.0M at NAV + realized $556.8M + distributions $1.27B = $2.52B · hold scenario total $6.09B · modelHOLD. NEVER SELLHOLD:~$6.09BSELL THE MAX:~$2.52B
Remaining holdings at NAVRealized sales, cumulativeDistributions received, cumulativeHold scenario (value + distributions)

The dial is real liquidity, and holding still wins, because the burn concentrates whoever holds. Alignment by economics, not padlocks.

Cumulative cash to holders

CAD · distributions + buyback cash · model output
$3B$6B$9B$12B~$13.2B CASH DELIVERED BY 2040FOUNDERS $1.27BLEGACY $1.90BCOMMUNITY DISTRIBUTIONS $6.86BENGINE BUYBACK CASH $2.24BSCOUTS $949.5M20272027 · distributions: founders $1.20M · legacy $0.60M · community $1.40M · scouts $0.00M · buyback cash to sellers $3.20M · total $6.40M · model20282028 · distributions: founders $3.00M · legacy $1.60M · community $4.50M · scouts $0.10M · buyback cash to sellers $9.30M · total $18.5M · model20292029 · distributions: founders $5.70M · legacy $3.30M · community $10.3M · scouts $0.40M · buyback cash to sellers $19.7M · total $39.4M · model20302030 · distributions: founders $13.3M · legacy $8.50M · community $29.5M · scouts $2.30M · buyback cash to sellers $46.1M · total $99.7M · model20312031 · distributions: founders $29.3M · legacy $20.7M · community $76.5M · scouts $8.40M · buyback cash to sellers $84.3M · total $219.2M · model20322032 · distributions: founders $70.6M · legacy $55.7M · community $213.9M · scouts $25.9M · buyback cash to sellers $140.1M · total $506.2M · model20332033 · distributions: founders $132.1M · legacy $113.5M · community $444.1M · scouts $54.8M · buyback cash to sellers $218.4M · total $962.9M · model20342034 · distributions: founders $215.5M · legacy $200.6M · community $793.0M · scouts $98.4M · buyback cash to sellers $327.9M · total $1.64B · model20352035 · distributions: founders $320.2M · legacy $322.3M · community $1.28B · scouts $159.2M · buyback cash to sellers $478.0M · total $2.56B · model20362036 · distributions: founders $447.9M · legacy $487.1M · community $1.92B · scouts $241.6M · buyback cash to sellers $674.8M · total $3.77B · model20372037 · distributions: founders $604.1M · legacy $711.0M · community $2.75B · scouts $353.6M · buyback cash to sellers $932.6M · total $5.35B · model20382038 · distributions: founders $790.3M · legacy $1.01B · community $3.82B · scouts $502.0M · buyback cash to sellers $1.27B · total $7.39B · model20392039 · distributions: founders $1.01B · legacy $1.40B · community $5.17B · scouts $697.1M · buyback cash to sellers $1.69B · total $9.98B · model20402040 · distributions: founders $1.27B · legacy $1.90B · community $6.86B · scouts $949.5M · buyback cash to sellers $2.24B · total $13.2B · model
FoundersRolled legacy holdersCommunity distributionsEngine buyback cash to selling holdersDeal Scouts
The 2040 Readout

Who ends with what: read it honestly.

Four readings from the model's last row, stated the way we would want them stated to us.

~$2.52B
Founders, selling the max
Value + realized + distributions, 2040
~$6.09B
Founders, never selling
Holding wins. The burn concentrates holders
62.4%
Community ownership
Majority from 2028, every year after
$13.71 / $12.11
NAV per share, dial vs hold
Essentially unchanged whether founders sell or hold
01

Selling the maximum dial every single year, founders end 2040 holding 50.8M shares worth ~$697M, having realized ~$557M in disclosed sales and received ~$1.27B of cumulative distributions. A ~$2.5B modeled outcome from a capped 20% start.

02

Holding instead, founders end at ~33% ownership, because buyback-and-cancel concentrates whoever doesn't sell. That drift is exactly why the dial and the disclosure exist: the burn rewards holders, founders included, and the cap plus transparency keep it fair.

03

The community ends above 62% of supply in the dial scenario (higher than the 54% winning-launch average) and NAV per share is essentially unchanged whether founders sell or hold ($13.71 vs $12.11).

04

Deal Scouts, starting from nothing, end with a cumulative modeled outcome above $1.6B, sourcing deals on NapkinDeals.com becomes a genuine profession.

The 2040 table: dial scenario

CohortShares heldValue @ NAVRealized cashCumulative distributionsOwnership %
FoundersDial maxed every yearHold scenario instead: ~$6.09B total and 33.1% ownership, the burn concentrates whoever holds.50.8M$697.0M$556.8M$1.27B9.5%
Rolled legacy holders100.0M$1.37B, $1.90B18.7%
Community & public333.8M$4.58B$2.24B$6.86B62.4%
Deal Scouts50.0M$685.5M, $949.5M9.4%

Cohort outcomes are model outputs under the listed assumptions, valued at modeled NAV per share. Not price predictions, not compensation promises, and not guidance. Distributions are shown on a fully-staked basis. The Founder Liquidity Dial parameters shown (10%/yr) are the modeled ceiling; final parameters are published in the token documents.

The Price Question

What this does for price, and why we won't chart it

Every mechanism in this model points at one number pair: NAV per share and FCF per share. Price is what the market pays for that pair, and no honest model predicts it. Uniswap burned $596M and hit a cycle low two months later; buybacks cannot outrun beta, and anyone who charts a price curve for you is selling you one.

What the model does show: a share count that only shrinks after 2031, a NAV floor defended by funded quarterly tenders, distributions that grow three orders of magnitude, and an issuer contractually banned from diluting you below NAV. If the market ever prices $NPKN below the attested numbers on this page, the Engine's tender is the mechanical answer, and if it prices it above, treasury issuance above NAV makes every deal accretive. There is no third mode.

The Honest Case

The downside case, published first

Most projects publish the upside and bury the stress test. We publish the stress test on the same page, with the same charts, before anyone asks.

Stressed assumptions

35% fewer deals a year, FCF conversion 50% instead of 60%, organic growth 3% instead of 5%, financing slips, integration drags, markets stay hard.

  • 6,528 deals by 2040 instead of 10,000. The target slips roughly three years.
  • NAV per share still compounds every single year: $0.70 → $9.47.
  • The burn countdown still completes (2039). Leverage still peaks ~3.4x and falls.

The mechanisms don't break; the timeline stretches. Delay, not derailment, is the designed failure mode.

Deals per year, base vs downside

Model output
2,5005,0007,50010,000BASEDOWNSIDE10,0006,52820262026 · base 18 · downside 18 deals · actuals basis2027 · base 32 · downside 26 deals · model20282028 · base 60 · downside 43 deals · model2029 · base 105 · downside 72 deals · model20302030 · base 225 · downside 150 deals · model2031 · base 525 · downside 346 deals · model20322032 · base 1,000 · downside 656 deals · model2033 · base 1,620 · downside 1,061 deals · model20342034 · base 2,375 · downside 1,554 deals · model2035 · base 3,182 · downside 2,081 deals · model20362036 · base 4,007 · downside 2,620 deals · model2037 · base 5,149 · downside 3,366 deals · model20382038 · base 6,436 · downside 4,206 deals · model2039 · base 8,058 · downside 5,264 deals · model20402040 · base 10,000 · downside 6,528 deals · model
Base caseDownside case
Metric2032 base2032 downside2040 base2040 downside
Deals1,00065610,0006,528
NAV/share$1.99$1.46$18.42$9.47
FCF/share$1.16$0.50$17.40$7.55

DOWNSIDE 2040: 6,528 DEALS · NAV/SHARE $9.47 · STILL RISING EVERY YEAR

Basis of Presentation

The Path to 10,000 is an illustrative, rule-based model published to be attacked, not a forecast, projection, or guidance. All figures CAD. Model outputs depend entirely on the listed assumptions; actual results will differ, possibly materially. 2026 figures are the management-reported run-rate basis of the dashboard; every later year is model output. Deal vignettes are illustrative and are not announcements or actual transactions. Nothing on this page is an offer of securities or a representation about the future price or value of any token; any offer of $NPKN will be made solely through an approved prospectus, offering memorandum, or applicable exemption.

The model is the invitation.

Rebuild it, stress it, break it if you can. The assumptions are all here, and the mechanisms are bound in the founding document.